The Show-Me Institute
Advancing liberty in Missouri
The Show-Me Institute believes positive growth in Missouri school systems starts with clarity. The institute dreamed of creating a project that would build awareness of school district performance — and our data visualization service made it possible.

Creating transparency in Missouri school districts
CHALLENGE
The Show-Me Institute created the Missouri School Rankings project in a bid to motivate reform. Their goal was to provide parents, policymakers, educators, journalists and taxpayers with a resource that would make student performance data easy to access and understand. The brand had the figures — but without a platform, they lacked power.
SOLUTION
Paradigm transformed numbers and statistics into something more palatable. Our data visualization designers worked with developers to create MOSchoolRankings.com: an interactive, easy-to-use map that functions as an annual report card for Missouri’s public schools.

Data Visualization Service
Our designers transformed data from the Missouri Department of Elementary and Secondary Education into an interactive map.
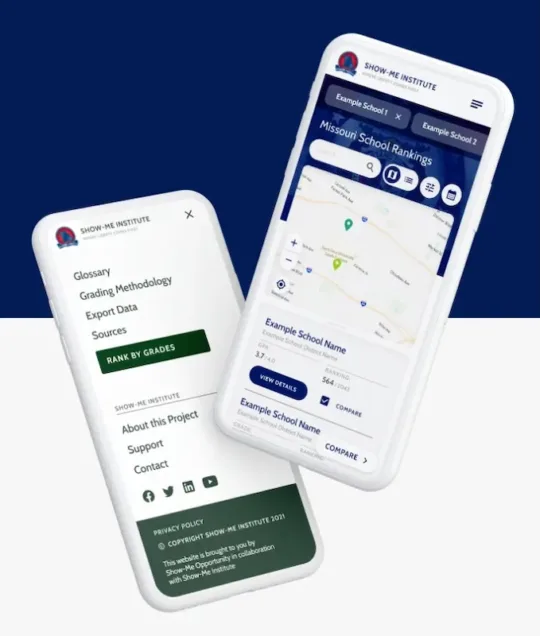
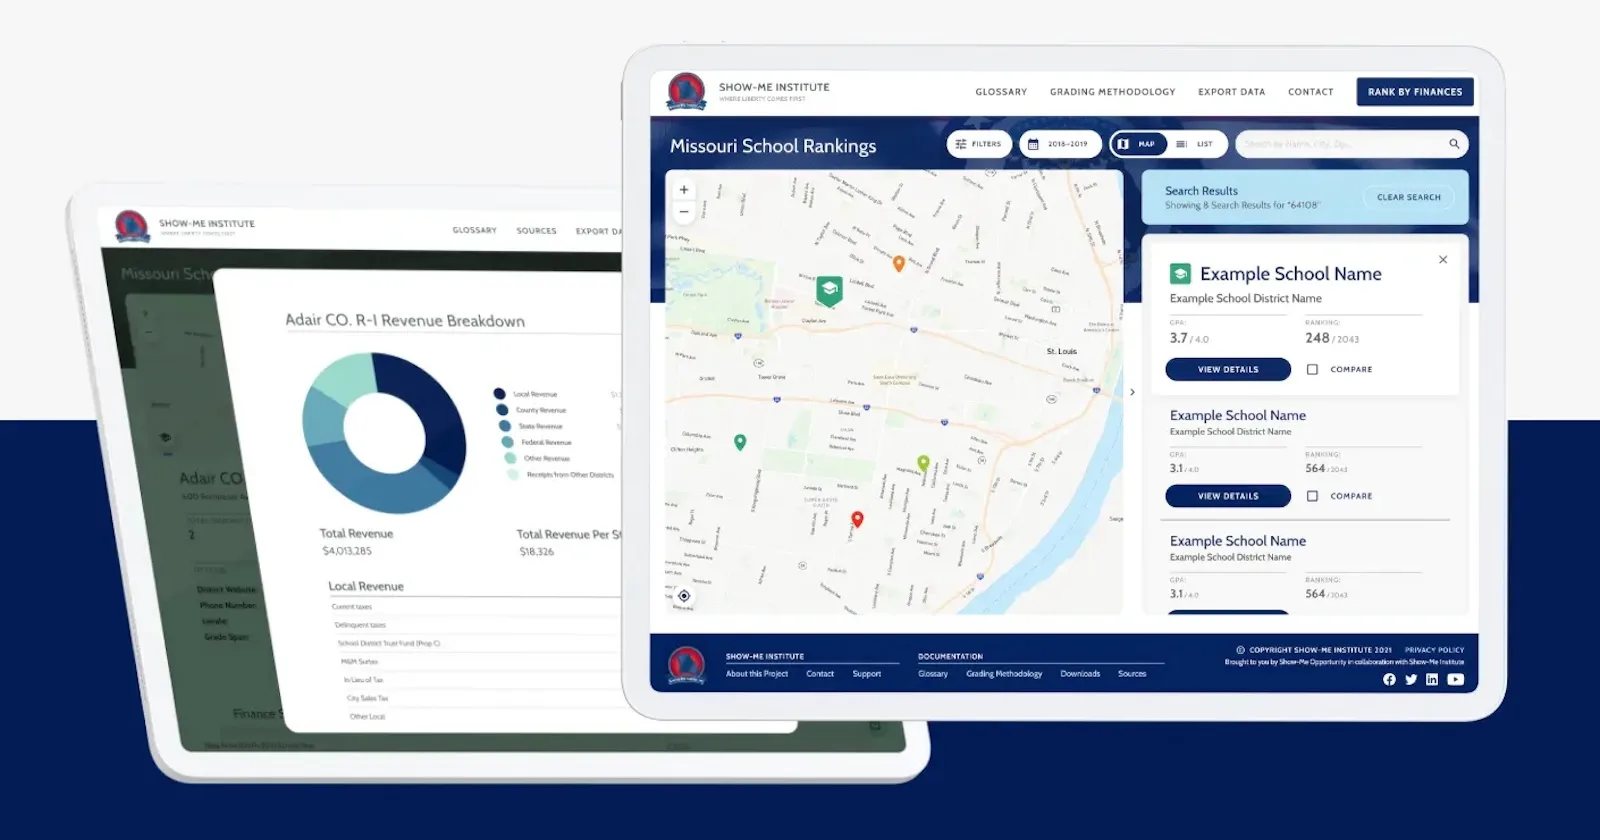
We organized data from the DESE data under bubbles and pins. Users could click each to reveal a pop-up display with the school’s name, grade, ranking and a link to a dedicated landing page.
Color became a visual performance indicator. Green meant good, red meant bad and every color in between signaled space for improvement. The contrast this created encouraged visitors to explore performance gaps, investigate why they existed and lobby for equity alongside the Show-Me Institute.
Zooming, lists and filters empowered users to customize their experience. Additionally, data visualization designers integrated toggling options, including:
- Individual schools vs. school districts
- School districts vs. legislative districts
- Map view vs. list view
- Comparative school view
- Academic year information
Application Build
Our developers utilized web technologies, such as Ruby on Rails and GeoJSON, to create an advanced yet easy-to-use platform.
Our data visualization service produced a multi-layer application that seamlessly integrates data from multiple sources while minimizing the need for manual intervention.
The platform automatically loads and accurately displays data, while GeoJSON translates complex geospatial information into a clear, geographically accurate map.
We also designed the Show-Me Institute’s page to connect interactive map markers to linked pages. Users can click on a marker to view the aforementioned popup and navigate to a dedicated page with school-specific data, including annual funding, average income, subject performance and more.
-
7.1K
users 30 days post-launch
-
88.6%
new visitors 30 days post-launch

Next Project
Industrial Battery Products