The Show-Me Institute
Advancing liberty in Missouri
The Show-Me Institute believes positive growth in Missouri school systems starts with clarity. The institute aims to build public awareness of school district performance and to create an education system focused on higher standards, equity and accountability.

Creating transparency in Missouri school districts
CHALLENGE
As the Show-Me Institute pursued progress in the education system, its team created the Missouri School Rankings project to motivate reform. Their goal was to make student performance data more transparent by providing parents, policymakers, educators, journalists and taxpayers with easy-to-understand information about Missouri school districts. The brand had powerful figures — it just needed a platform.
SOLUTION
Paradigm partnered with the Show-Me Institute to transform numbers and statistics into something more palatable.

Data Visualization
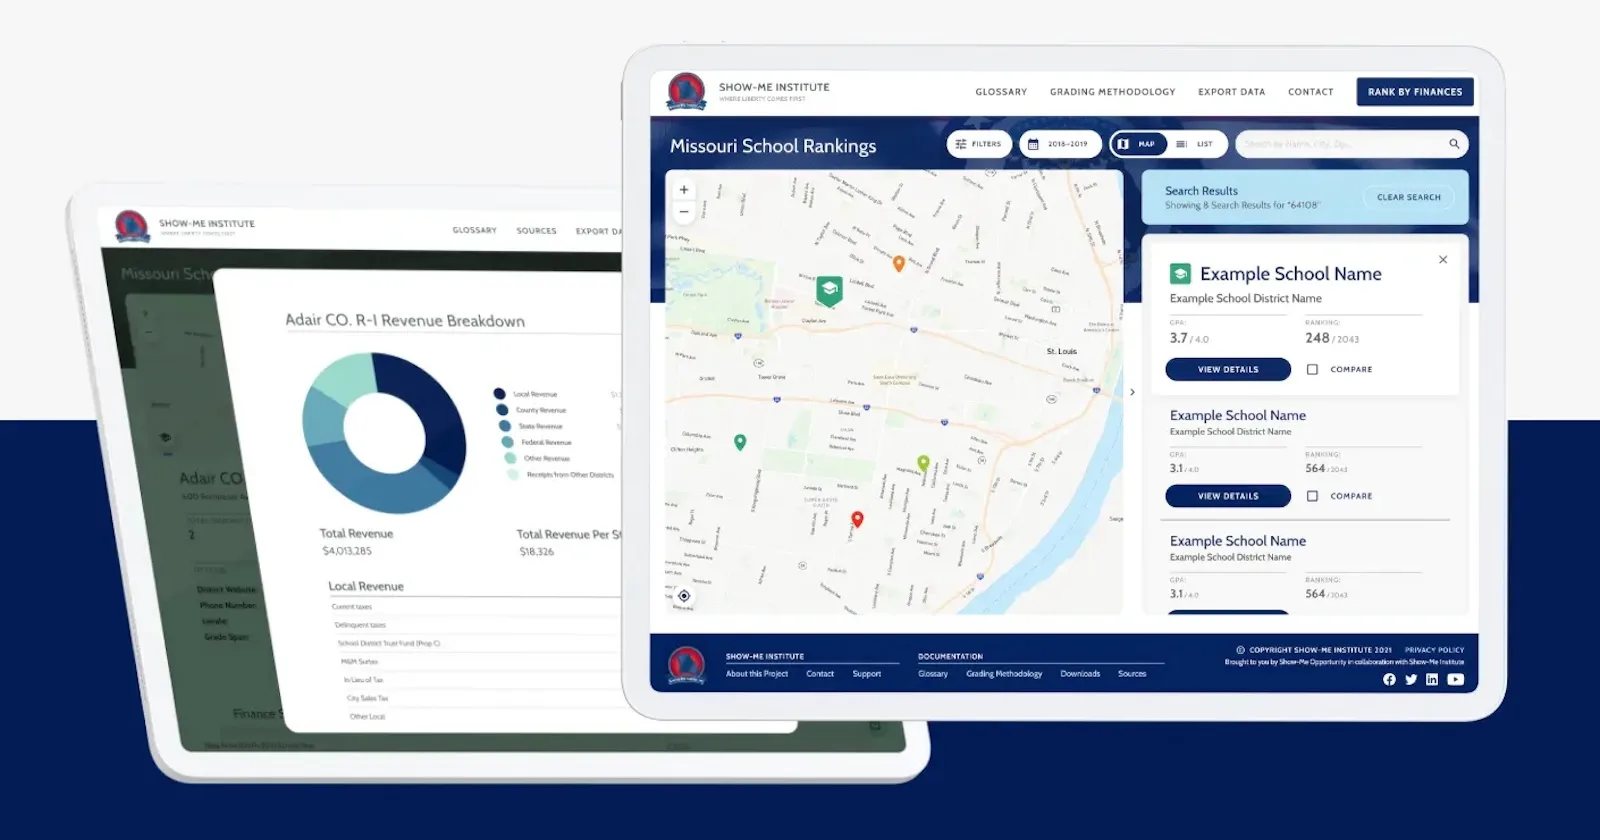
Using information from the Missouri Department of Elementary and Secondary Education, we created a dynamic interactive map.
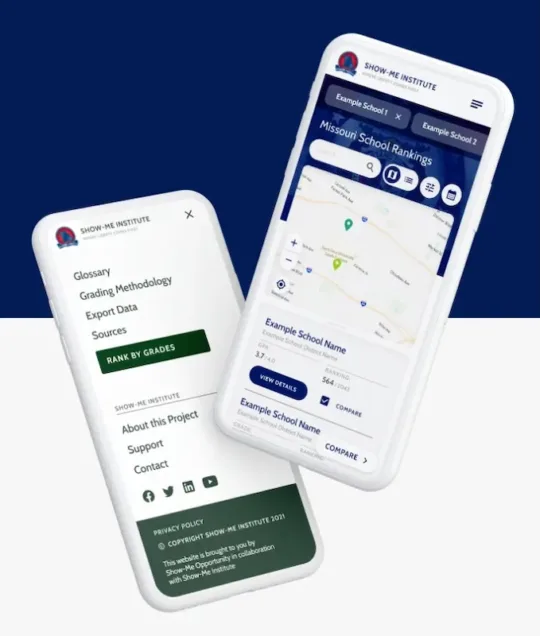
This web application features a state map that visualizes data representing public school districts’ statewide rankings.
Using color coding, our team made it easy to quickly reference top-performing schools in a given area versus low-performing ones. The grades for each subject are also color-coded so viewers may quickly identify areas that schools can improve. The stark contrast between red and green motivates visitors to explore the performance gap between schools and ultimately address it.
We ensured the Missouri School Rankings project page was efficient and engaging for all who visited. Users have opportunities to customize their experience through zooming, lists and filters detailing important school district data. Paradigm provided map toggling options, including:
- Individual schools versus school districts
- School districts versus legislative districts
- Map view versus list view
- Academic year information
Application Build
Our team utilized web applications such as Ruby on Rails and GeoJSON to create an advanced yet easy-to-use platform.
Multi-layer applications run smoothly together without manual interference, ensuring the webpage loads quickly and accurately. GeoJSON was particularly useful in interpreting geospatial data into a simple, geographically accurate map.
Our team built the page to funnel data through various pop-ups and linked-out pages. As a result, location markers for each school are interactive. Each user can click on a marker to view the school district name, ranking and average school GPA in addition to navigating to a new page that outlines information about annual funding, average incomes and more.
-
7.1K
users 30 days post-launch
-
88.6%
new visitors 30 days post-launch