Expertise
Custom Data Visualization Services
We agree that data makes the world go ‘round — but lists and spreadsheets may not get your core message across. Data visualization design systems offer a dynamic avenue for complex storytelling. Through our data visualization services, Paradigm transforms values into visual elements that get to the heart of what you’re trying to communicate.
Types of Data Visualization
Paradigm uses data visualization principles to create opportunities for our partners to visualize insights. Data visualization graphics boil complex numbers and metrics into formats that are easy to consume. Depending on your data, these projects may take different forms, such as:
Bar Charts
Bar charts showcase a distribution of data points or provide comparisons.
Line Graphs
Line graphs are often used to track change over a defined period of time.
Pie Charts
Pie charts summarize sets of nominal data or display differing values in a given variable.
Maps
Maps can be implemented to show a geographic relationship between data points.
Factors of Data Visualization Services
Our data visualization services are scalable, adapting to be simple or complex as needed. As our designers and developers tactfully transform your data, we often pay close attention to the following factors:
Branding
Data visualization designers should create with your brand identity in mind. Color systems ensure we stay within brand guidelines while separating crucial data points. Our team carefully crafts color systems to highlight pieces of importance, ensuring that your audience will take away a key insight within one visit.
Cohesion
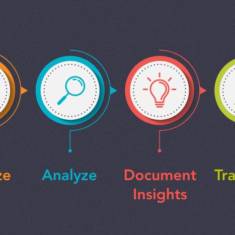
Our technology and design teams work closely in data visualization projects, finding ways to translate your information from one platform to another. Data visualization services provide an outlet to analyze and document insights. By the end of our process, you ensure data and design live in harmony through data visualization design systems.
Navigation
With large-scale data visualization tools, your model must be easy to navigate. Our data visualization designers create visuals that follow a distinct hierarchy — your audience will quickly know where to click, what information it will lead them to and how to find their next insight.
Interactivity
Our team augments the consumption of data further through interactive elements. By incorporating features such as sliders and clickable pop-ups, we encourage consumers to dive deeper into the numbers. The element of discovery captivates your audience and makes it easier to retain critical information.
Data Visualizations We’ve Created
Paradigm’s data visualization services elevate and excite. Our design and development team follows data visualization principles to ensure data contributes to your story in a cohesive yet enticing way. Explore a few of our favorite digital and data visualization projects.
Our Design Capabilities
Beyond our work on data visualization design systems, Paradigm offers comprehensive design solutions to fit every marketing need. From websites to print media, we transform your platforms into branded, unforgettable experiences. Discover how our team of traditional, digital and data visualization designers creates the extraordinary.
The Paradigm Perspective
As the digital world evolves, we need to change perspectives around the marketing tools at our disposal. We develop insights for our partners and shift ideas around what marketing may look like. Stay up-to-date with Paradigm — explore how we rethink design and data visualization services.


