What is the overall mission of the Show-Me Institute? Through what channels do you achieve this?
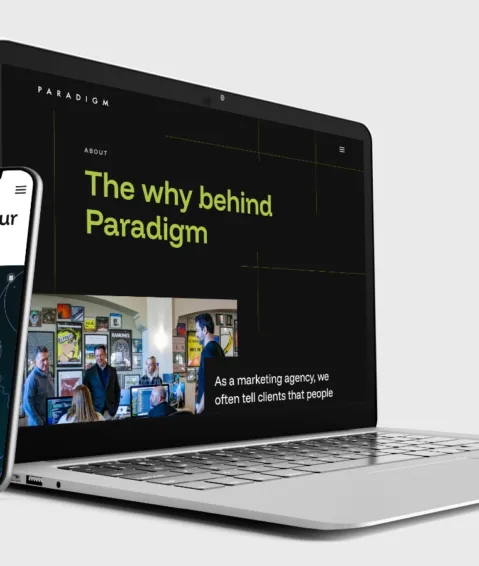
ZACH: The Show-Me Institute is a free-market public policy organization specializing in education around public policy for Missouri. We focus on free market principles and advocate for public policy in the areas of healthcare, education and tax policy. We achieve our mission through traditional channels — print media, radio, digital channels, social media, online news hits and from building websites.
SUSAN: In addition, we give in-person testimony in the capital, Jefferson City, and do events across Missouri. We also develop and produce research on the policy topics that we are interested in pressing with the state.
For those who don’t know, what is the Missouri School Rankings project?
SUSAN: The Missouri Department of Elementary and Secondary Education (DESE) has a website and produces a lot of data, but it’s hard to find and often in different places. Every school and district has an ID, but you can’t find one place with all the data.
After talking about it for a while, we decided to produce our own report card. We built a website that has two data sets: a school set and a district set. We gathered all this data into one Excel file. For 10 different indicators, calculated letter grades by putting all the schools or the districts on a curve — giving them A, B, C, D or F based on their relative position.
We decided to find somebody who could build a website that would make it easy for folks on a laptop or phone to find the school or district they’re interested in. Paradigm is the vendor we went with to create the Missouri School Rankings website and we are very pleased with it.
How has the Missouri School Rankings Project evolved?
SUSAN: We realized that every district in the State of Missouri also creates a massive financial report every year called the Annual Secretary to the Board report, which has hundreds of lines of numbers about revenue and expenditures.
We wanted to figure out a way to make those numbers equally accessible to people so they could easily go in and find what they’re looking for. Once again, we reached out to Paradigm to build a website for average users trying to get details on how districts are getting and spending money. We wanted to make data that is publically available easy to find and easy to use.
What would you say made Paradigm stand out when compared to other agencies?
SUSAN: When we began this project, we reached out to at least two or three other firms. Paradigm was the only local one — we are literally down the street from Paradigm, which is great. Paradigm gave us the most reasonable timeline and budget, which were two big points for us.
I think that Paradigm saw the vision we had. It didn’t have to be complicated, but we wanted it to be an easy user experience.
What challenges inspired you to create a web app?
ZACH: One of the challenges we have as a think tank is making the abstract nature of a lot of public policy relate to people’s day-to-day lives. One of the advantages of talking about individual schools is that it clicks right away. Being able to show the performance of your individual schools or the finances of your district helps people make that clear connection.
SUSAN: Most people, especially parents, in my opinion, care about their kids’ school and school district. They’re not prevented from getting that information — you’re allowed to if you want to make the effort, but districts don’t readily put data out there in front of parents.
Another challenge is that, from one year to the next, the state might change how they measure something. One academic measure reported on schools and districts is a measure of growth in English and math. It used to be that 50 was the average and the measurement was a number below or above, and then they changed the average one year to zero.
On the finance site, expenditures fall into these categories on reports and they move them sometimes. So each year, we’ve had to work around some of the changes the state makes.
Did you have a clear vision going into the project?
ZACH: We wanted to be map-based. The user interface was always really important. But yeah, I don’t think we had a ‘This is what it needs to look like’ vision — Paradigm was great in helping us along. The team would be able to express an end goal we wanted to accomplish and then Paradigm would say: ‘Okay, this is how you need to achieve that on the website.’
SUSAN: There were just a couple of things, from the mind of a parent, I thought needed to be there — the map, the simplicity of it all, being able to compare between a small number of schools and being able now to compare years.
What would you say has been the public response to the application?
ZACH: When we launched the site, we did a social media campaign and a traditional media campaign. In general, the response was positive. I think a lot of people were overwhelmed by the amount of data that was accessible.
A lot of people didn’t know the basic facts about schools, whether performance or finance. People were genuinely surprised at some of the numbers that were on the website.
SUSAN: I’ve had people reach out to me from across the state. A couple of legislators have gotten used to using it now and have reached out to say: ‘When are you going to put up another year of data?’
We have had multiple people say it’s easier to use than anything that the state puts out. I’ve had a couple of school board members who asked for presentations to go through what’s on there and how we came up with these numbers. We’ve had a lot more traffic than I was expecting.
ZACH: The methodology was important to all of us. It’s public data, so we wanted it to be downloadable. If you didn’t believe us for some reason, you can go in and download everything. That was really important from a transparency, integrity and a user standpoint.
What have been the most valuable aspects of our partnership?
ZACH: The constant communication during this whole process.
For something this complicated, being able to communicate and have constant feedback has been really great.
SUSAN: I think we went into the project a little wary, but Paradigm stuck with our timeline and price. We were very conscious of laying out exactly what we wanted and sending the data in the format Paradigm needed. We try to comply with their data needs, which has helped us.
How has Paradigm’s ongoing technology expertise benefited your organization?
ZACH: When we were in the early stages of building the map, it seemed pretty complicated. Getting it to be easy to use and populated correctly was something the technology team worked through. It works great now.
The other benefit was the search function. It’s such a critical part of a website that has hundreds of thousands of data points that someone can search. The team was great at figuring out the best way to design and implement a functional search.
SUSAN: Last year, when we knew that we would be adding another year of data, Paradigm reached out to say that we needed to upgrade the version of the software language the web app was written in. By doing that upfront, we saved money on the back end.
How do you see your marketing strategy evolving in the future?
SUSAN: We built this website before COVID-19. We started with 2018-2019 data and a big plan — but, in the second year, we couldn’t add data because there wasn’t any. Now, I think it’s important to keep the pre-pandemic numbers on there because that’s a point of reference for folks.
We have an opportunity to market the website a little bit differently because we will be able to talk about how the dust has settled on the pandemic. One thing I would like to do is add graphs to the website so that folks can look at how things were before and after the pandemic.
ZACH: We’ll be making a bigger deal moving forward about new data availability. Also, we’ll continue to make it accessible and easy to use.
What’s one piece of wisdom you’ve gained from our partnership that you would share with others?
ZACH: It’ll all work out in the end, but it’s not going to go exactly how you thought. Even if you have a timeline in mind, be flexible.
SUSAN: Have as much upfront knowledge as you possibly can. We were able to get a lot of preparation done on our end so that when we went to Paradigm, we could say: ‘This data needs to be at the top’ and ‘This is how it needs to look.’
That would be my advice. Know the data as much as possible and have at least two or three different people do a complete data check before you send it off.
Is there anything else you’d like to add?
ZACH: As we get further and further out from the pandemic, I think the site is only going to become more and more valuable for that before and after comparison that people are going to be making for years to come.
SUSAN: I don’t think we’re going to give up on the project anytime soon. Things haven’t gotten better at the state level — they’ve gotten worse. The data is messier, so we’re going to keep doing this.
Partner with Paradigm
We’ve been in the marketing game for nearly 30 years. In that time, we’ve worked with some incredible people: business owners, attorneys, scholars and manufacturers. Paradigm’s expertise has become invaluable to ambitious brands searching for data visualization, software services, website design and beyond.
Have a project for us? Contact our team to uncover real results for your organization.