Behind the Data
When you think of the word “data,” you may think of line graphs or bar graphs. However, data visualization remains fluid by existing in diverse formats across nearly every industry. Banking, finance, construction, healthcare, education, technology services — you would be hard-pressed to find an industry where data does not influence decision-making. Let’s take a closer look at one industry where we worked to transform information into data visualization.
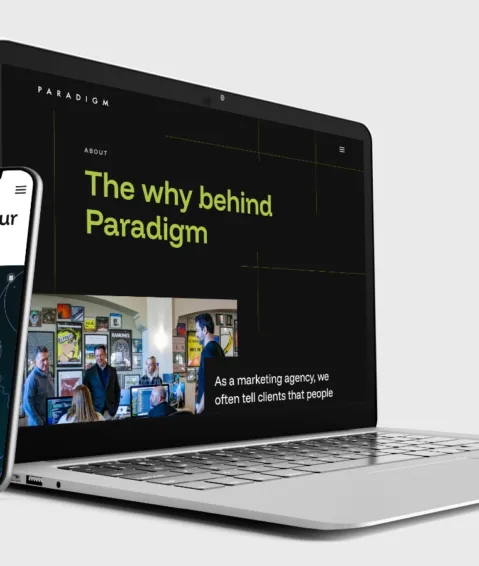
Case Study: Show-Me Institute
The Paradigm team uses these tools to customize features, functionality and create user interface elements. One such project was a dynamic interactive map for the Show-Me Institute, a public policy think tank. This web application features a state map that visualizes data representing public school districts’ statewide rankings.
Our team utilized web applications such as Ruby on Rails and GeoJSON to create advanced yet straightforward functionality and visuals. We gave users opportunities to experience the visual, through zooming features, lists and filters. Users could also click on location markers for each school to receive the school district name, ranking and average GPA of the school, paired with a linked page that outlined information about annual funding, average incomes and more.
This presentation utilizes all data points while also offering a visual shortcut to make observations about Missouri schools. Visitors who only viewed an overview map perspective may identify which districts need the most aid through color cues. These takeaways influence their support for public policy and help the Show-Me Institute carry out its organizational mission.
Using Data Visualization in Your Business
Whether you are trying to record history, analyze behaviors or make changes in society, your business may utilize data visualization tools. While we encounter these tools often as we consume media, many do not fully realize the process behind creating impactful visuals.
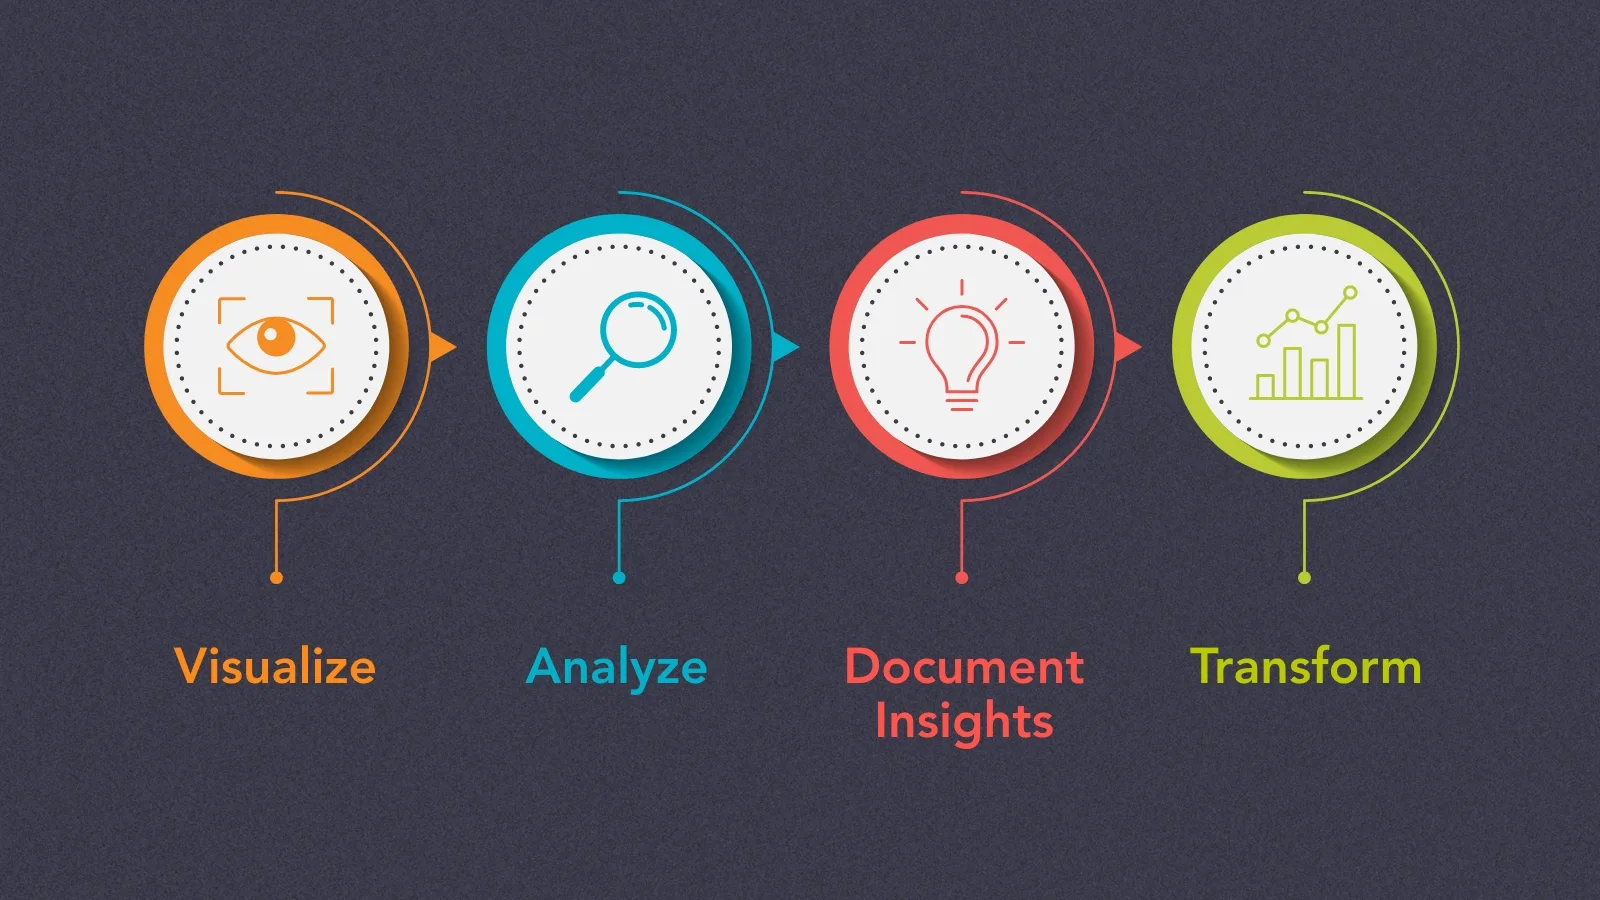
To find the most impactful visual for data, you must go through the following stages.
- Visualize. First, you must identify the best way to interpret data by condensing the initial data, often into geometric shapes. Common formats include pie charts and line graphs.
- Analyze. Once visualized, you can analyze data for patterns across varying periods and conditions. A pattern, such as a downward trajectory, may add an influential layer to your story.
- Document Insights. You must document each observation to help you determine the most impactful data sets that you can display in visual formats.
- Transform. Developers add new formats and interactive elements to data visualization, transforming the lens through which your audience views the data. Filters, zooms, mapping and more ultimately change the way people see your data.
Benefits of Presenting Data Visually
Data may be written out in lists or explained in a paragraph — why make it visual? Visualizations strengthen the impact of your messaging, offering multiple ways to consume critical data points. They make it easier for our brains to process information by condensing key points and simplifying complex numbers. Rather than examining the difference between decimals, visuals allow you to quickly understand changes in a data set or the correlation between two points. Making complex topics simple influences audience decision making and changes behaviors, often in your favor.
For example, data visualization tools have proliferated during the COVID-19 pandemic. Charts showcased case numbers and the correlation between case numbers and preventative measures, such as mask mandates, stay-at-home orders and vaccinations. These tools were crucial to keeping the public informed and influenced their own decisions moving forward.
Work With Us
Information guides the actions of your audience, making a tangible difference for your business. Paradigm works with you to make the complex things simple by condensing big data sets into digestible visual stories. Contact our team today to start making a difference using data visualization.